As part of our latest AR HUD (augmented reality head-up display) testing project, we sat down with Margaréta Baumgärtner, Research Engineer at aHead Photonics, to take a closer look behind the scenes of the driving simulator study.
We talked about the goals and methodology of the test, the challenges the team faced, what the results revealed about AR HUD and static HUD solutions, and how these insights can shape the next steps in aHead Photonics’ head-up display technology development.
What was the main goal of the AR HUD driving test?
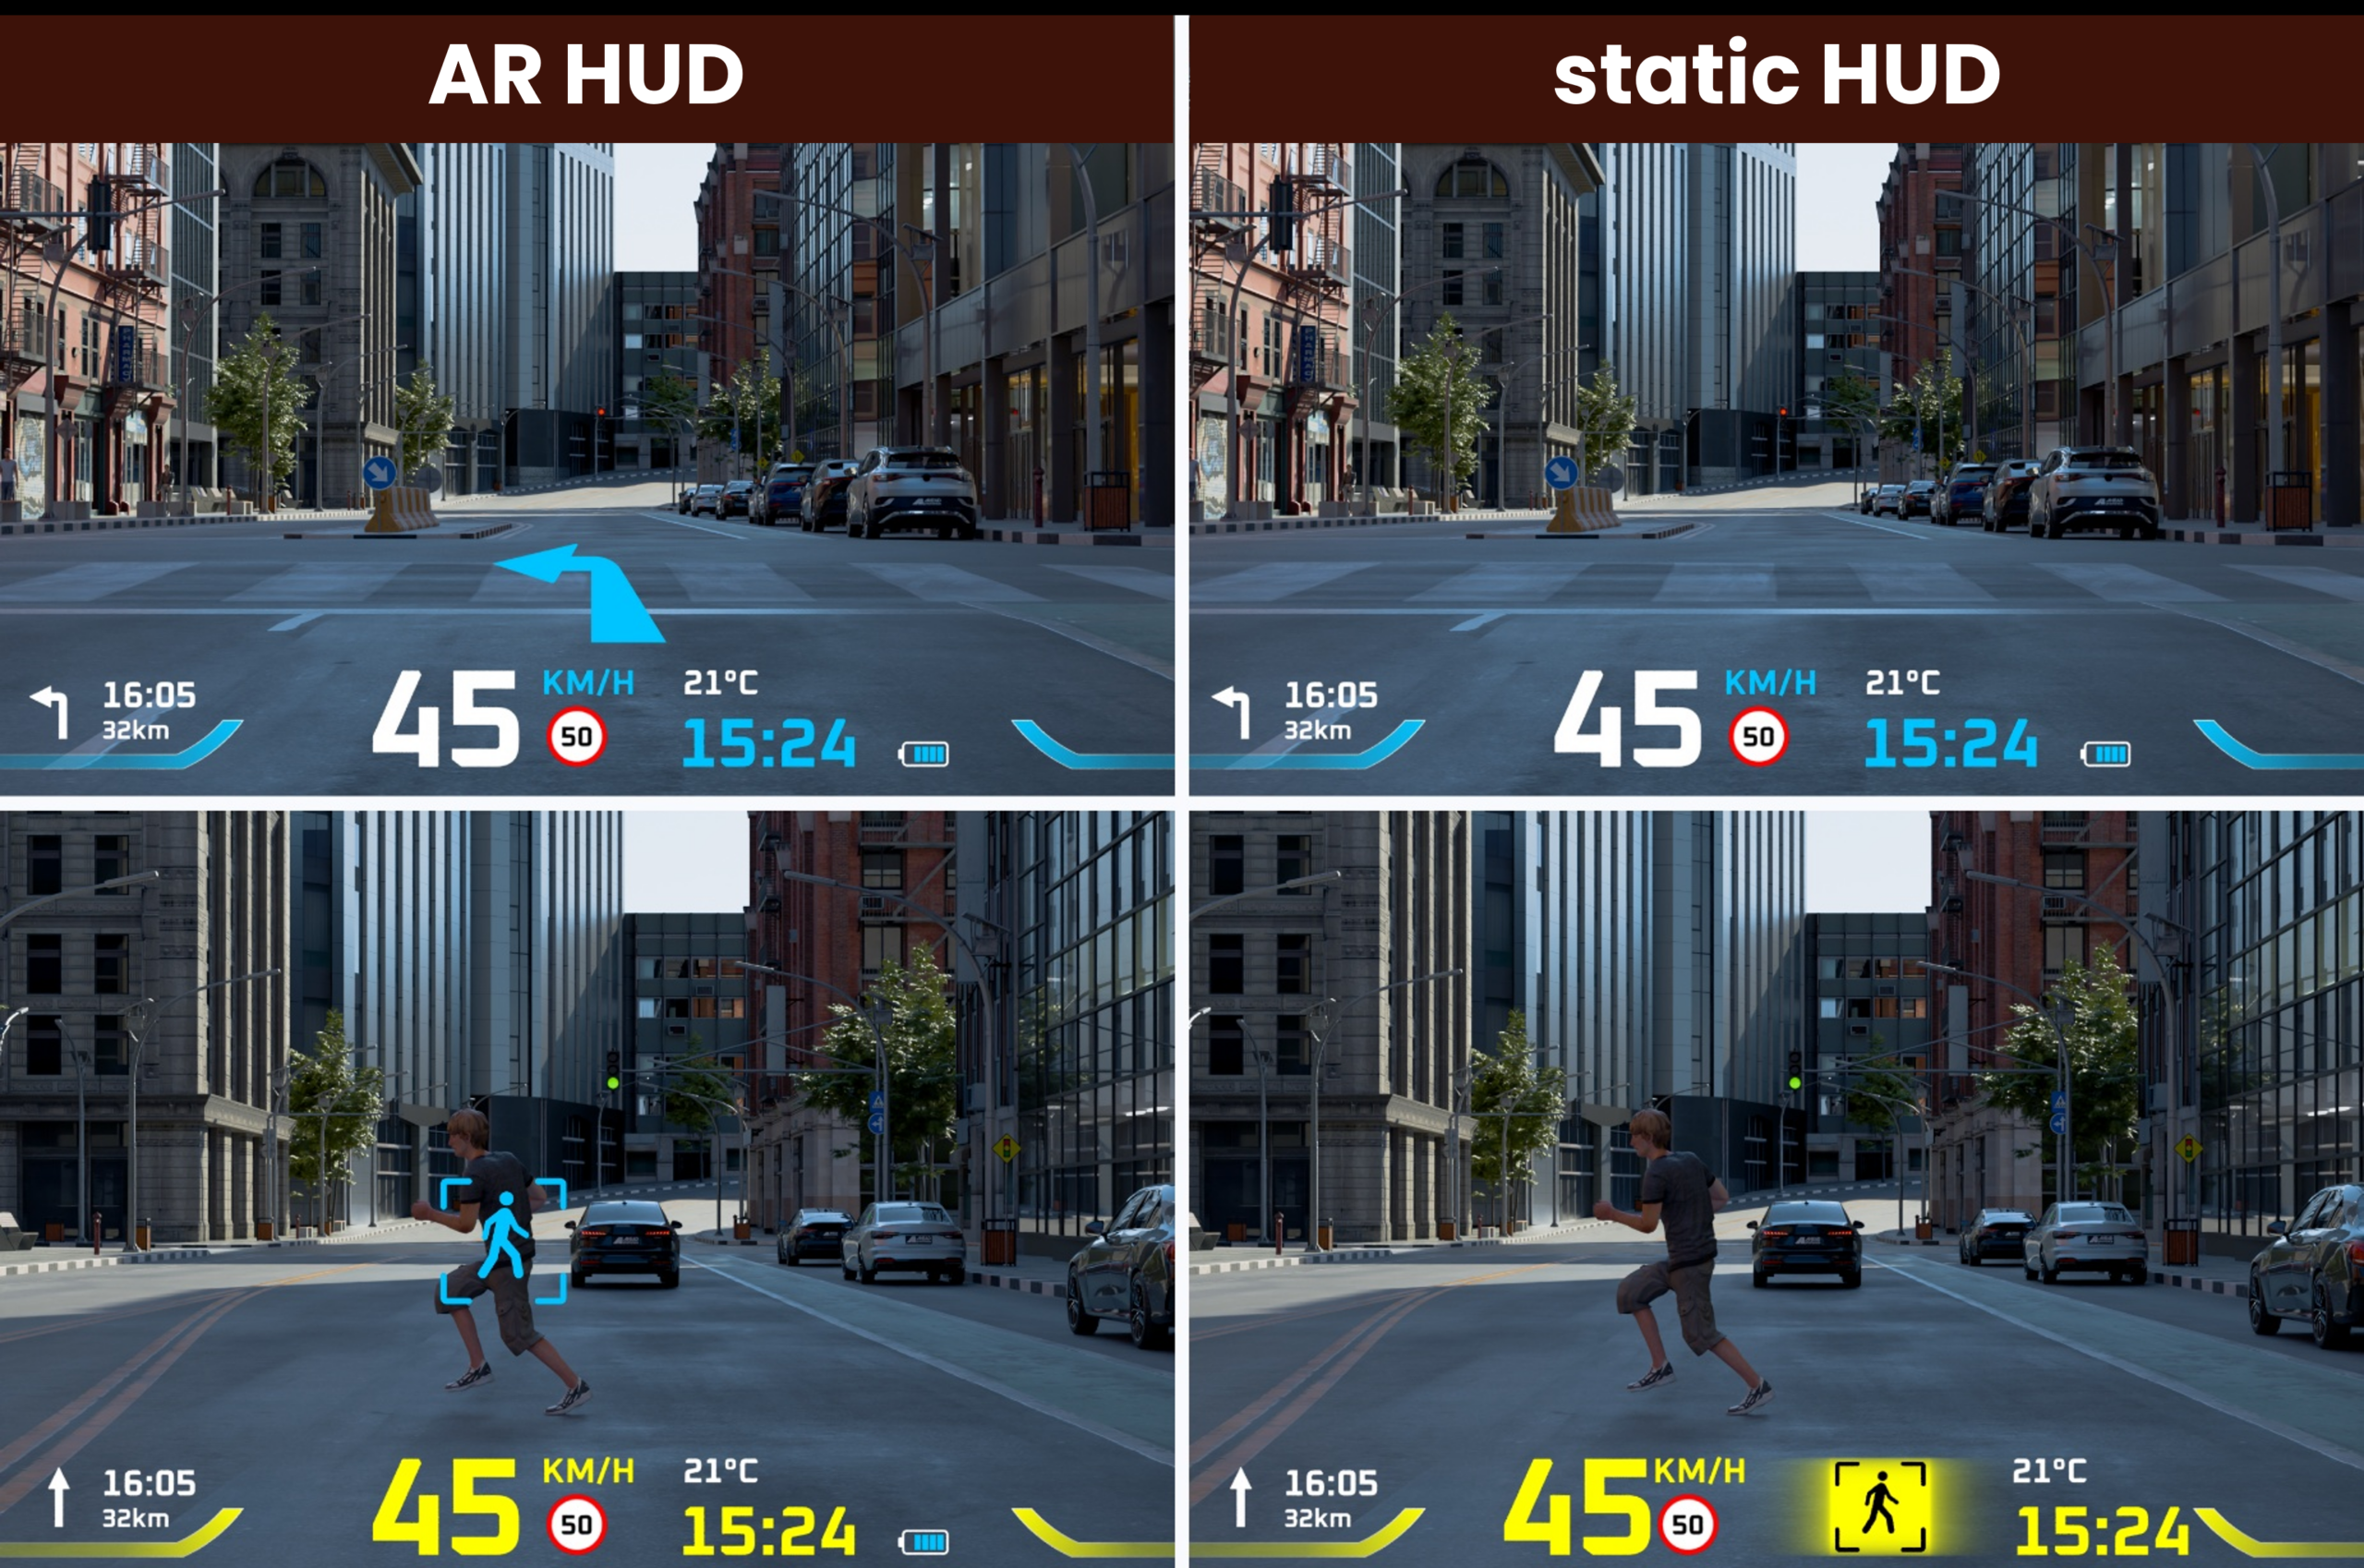
Our main goal was to understand how the way information is displayed on a Head-Up Display can influence driver behaviour. We compared an Augmented Reality Head-Up Display (AR HUD) with a conventional static HUD, focusing on navigation, hazard response and the overall driving experience.
How did the AR HUD differ from the static HUD during the test?
The static HUD displayed information in a fixed area at the bottom of the windshield. With the AR HUD, navigation arrows and hazard warnings were visually aligned with the surrounding environment. This allowed us to explore whether context-aware information could support drivers more naturally.
How was the AR HUD test set up?
We used our own driving simulator equipped with a steering wheel, pedals, windshield and HUD. After a short practice session, participants drove along a predefined route and encountered unexpected situations, including a suddenly braking vehicle and a pedestrian stepping into the road. During the drive, we measured steering and pedal inputs, vehicle speed, distance from hazards and reaction times.
What was one of the biggest challenges during the study?
For many participants, this was their first experience with this type of driving simulator. Some found controlling the simulated vehicle challenging, which could influence the collected data independently of the HUD itself. This was an important methodological lesson for us and will help us design more focused AR HUD tests in the future.
What was the most striking result?
The clearest result was in navigation: the AR HUD reduced route deviations by approximately 50%. Drivers were considerably more successful at following the intended route when navigation information was visually connected to the environment around them.
Did the AR HUD influence other aspects of driving performance?
We also observed a slight reduction in speeding and curb-driving incidents. Reaction times to hazards showed a narrower distribution with the AR HUD, suggesting more consistent responses across participants. Not every observed difference reached statistical significance, so these results should be interpreted with appropriate caution.
How did participants experience the AR HUD?
Participants found the AR HUD more enjoyable and slightly more efficient. At the same time, the static HUD was rated somewhat higher for clarity and visual attractiveness. This is a valuable reminder that AR HUD content needs to be carefully designed: placing information directly into the real-world view creates new opportunities, but it should always support the driver without adding unnecessary distraction.
What do these results mean for aHead Photonics’ future head-up display development?
The results strengthen our focus on AR HUD functionalities, particularly navigation. With its wide field of view and high brightness, our HUD technology provides a strong foundation for displaying AR HUD content precisely where it is most relevant to the driver. The study also gave us valuable methodological experience that will help us make future testing even more focused and effective.
What is the key takeaway from the project?
For us, testing is not simply about proving that technology works. It is about understanding how people interact with it. The next generation of AR HUD technology is not about displaying more information — it is about displaying the right information, in the right place, at exactly the right moment.